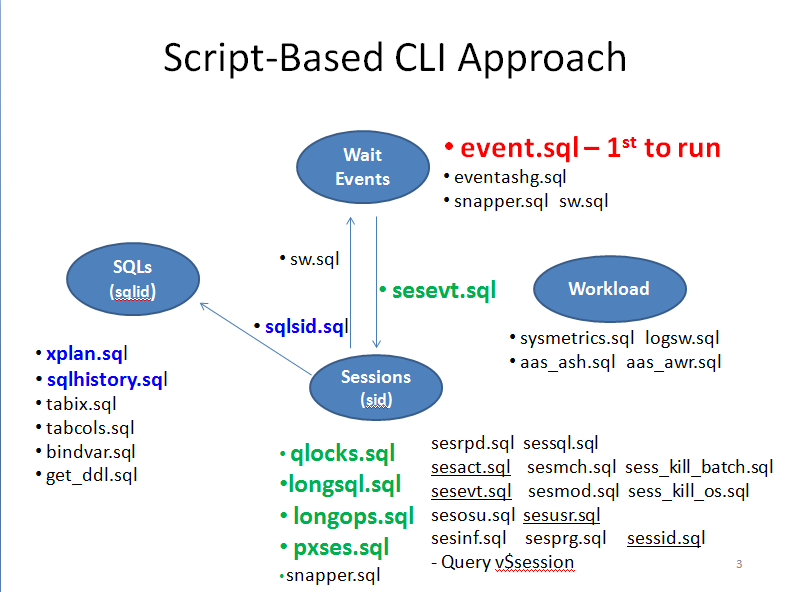
Whenever I troubleshoot Oracle production database performance issues or just need to do a health check, I will start with a script called event.sql, then I will most likely execute several other scripts from the SQL* Plus command line interface. In the above picture, I grouped my often-used scripts into four categories: Wait Events, Sessions, SQLs and Workload. After executing event.sql, the second script I probably will use is among those green ones; and the third probably from those among blue ones. The methodology I adopted is rooted in wait event analysis. All the scripts mentioned are in this zip file. Those scripts are intended to be used for pinpointing or narrowing down the problem area in the first 5 or 10 minnutes of troubleshooting production database issues, which often have a sense of urgency and require the solutions to stablize the system in short time.
In the following I will give short descriptions of the purpose of each script. Notice in a previous post I already explained about a few scripts.
- Wait Events
event.sql - first script to execute usually; giving the count of each wait event; a quick way to show if there are any abnormalities; in a typical OLTP type database, we shall see 'db file sequential read' as the most counted event after idle events. Tanel Poder shared the thoughts about first round session troubleshooting here.
eventashg.sql - show top 5 wait events for a given interval from gv$active_session_history; kind of like AWR top 5 wait events section; RAC -aware makes it probably the first script I will use to check RAC database health.
sw.sql - from Tanel Poder; given SID, show current wait event of a session.
snapper.sql - from Tanel Poder; very famous, check this link! In the SQL Server world, there is something similar. (snapper_dflt.sql in the zip file is a wrapper for convenience by me).
- Workload
sysmetric.sql - Display some system metrics from gv$system_metric_history such as Redo Generated Per Sec, Host CPU Utilization (%) and User Transaction Per Sec etc in the past 60 minutes. RAC-aware makes it the 1st or 2nd script I use to check RAC database.
aas_ash.sql and aas_awr.sql - Display average active sessions from ASH view and AWR, respectively. AAS is an indicator for workload or performance changes.
- Sessions
qlocks.sql - Display blockers and waiters based on v$lock view.
longsql.sql - Display long running SQLs; A quick way to find candidate "bad" sqls in the database.
longops.sql - Display long operations from v$session_longops.
pxses.sql - Display parallel execution server sessions.
snapper.sql - Yes again! It is really about sessions statistics and wait events.
sessid.sql - Given session SID, display the session related information.
ses*.sql - All those are querying v$session given some inputs such as: machine, server process id, OS user, database user and module etc.
sess_kill_batch.sql - Generate kill database sessions commands.
sess_kill_os.sql - Generate 'kill -9' command for killing server processes at OS level.
- SQLs
sqlhistory.sql - by Tim Gorman; query the "history" of a specified SQLstatement, using its "SQL ID" across all database instances in a database, using the AWR repository. Show execution statistics per execution plan.
tabix.sql - List of the indexes of a table and show on which columns and in which order the indexes are.Very usefull when tune a SQL.
tabcols.sql - Display table column CBO statistics. Very useful when doing SQL tunning. (from: http://www.roughsea.com ).
bindvar.sql - When tunning a SQL, I often need to find representative bind values from this script.
get_ddl.sql - based on dbms_metadata package to obtain definitions of objects. When tuning a SQL, sometimes we want to know the underline table structure and index definitions
Below are the screenshots of the output of several scripts:


Additional cool scripts - Collection of DBA Scripts resources on the web:
http://tech.e2sn.com/oracle-scripts-and-tools (Tanel Poder)
http://blog.enkitec.com/scripts/
http://evdbt.com/scripts/ (Tim Gorman)
http://www.idevelopment.info/ (Jeffery M. Hunter)
http://karlarao.wordpress.com/scripts-resources/
http://www.oracle-base.com/dba/scripts.php
No comments:
Post a Comment